Carbon dioxide levels since 1958 have been measured at Mauna Loa observatory.
I downloaded monthly data from the link and plotted January values on a graph.
A small rise in Co2 is observed.
This is the data on which the whole global warming panic is based.
https://scrippsco2.ucsd.edu/data/atmospheric_co2/primary_mlo_co2_record.html

The chart is usually presented as below.
Exactly the same data as above but they have multiplied the values by 10000 to get parts per million which looks more impressive than my percentages.
They do not start the chart at zero and don’t go up to 100% – mine even only went to 1%.

Sometimes we get charts like the one below.
The red line is Mauna Loa as above but the observatory only opened in 1958 so prior to that we have data from other sources such as tree rings.
Even if we accept this as a meaningful record, the scary looking red line is still the non-scary one shown in my original chart above.

So here is the famous ‘Hockey stick’ graph in all its glory, the scary red line is still there but they have made it even longer by ‘projection’, that is to say they ‘made it up’.
Note that the chart uses temperature instead of CO2 levels but the principle of construction is the same.
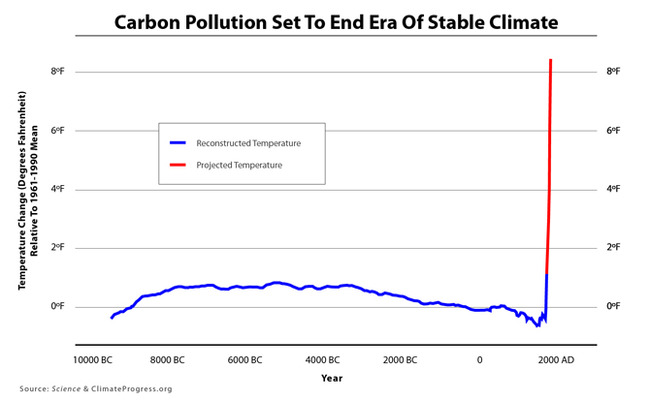
The chart above comes from this page here where they try to claim that it doesn’t even matter if the chart is fake anyhow.
https://www.theatlantic.com/technology/archive/2013/05/the-hockey-stick-the-most-controversial-chart-in-science-explained/275753/
They use tree ring data for the first part of the graph similar to CO2 so now we have tree ring data substituting for both CO2 and temperature.
But this can only happen if CO2 and temperature are inextricably linked, which is not so, and is in any case the thing that they are trying to prove in the first place!
The point of the fraud is that it is supposed to show a sudden change in temperature at a certain point in history.
The problem is that this point is precisely where the two different types of data meet, so all it really shows is that the two methods of measuring temperature give different results.
Related pages:
